Diagrams express the smoothing effect and accumulated energy depending on the smoothing method, prediction accuracy, and filter order (OLAP dimensions). Two days have been selected from the measured data (a day with medium vs. a day with high insolation, both of them with strong solar intermittency). Following time series are displayed:
Measured GI(t) and its smooth counterpart by the prediction accuracy, comparing all smoothing methods, having optimal LPF order applied - Figures 5, 6, 9, 10
Accumulated GX(t) by the prediction accuracy, comparing all smoothing methods, having optimal LPF order applied - Figures 7, 11
Smooth GI(t) by the filter order and prediction accuracy, comparing IPLPF and SPLPF smoothing methods - Figures 12-14, 18-20
Accumulated GX(t) by the filter order and prediction accuracy, comparing IPLPF and SPLPF smoothing methods - Figures 15-17, 21-23
Analysis by prediction error
A day with medium insolation
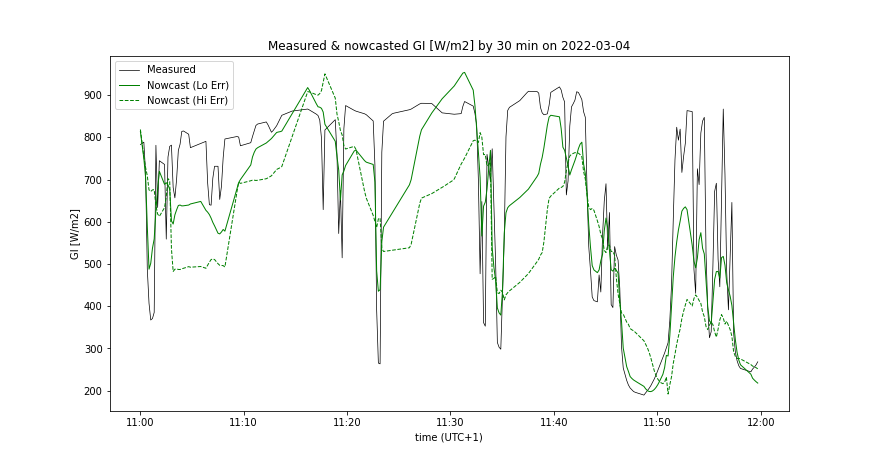
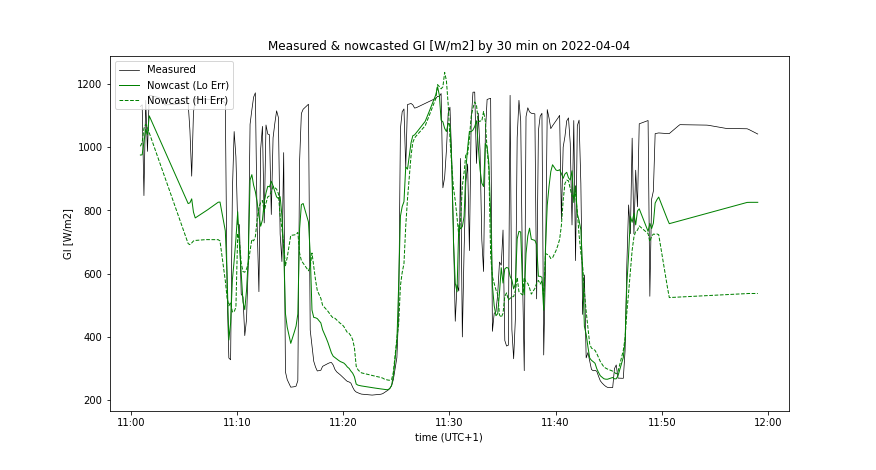
Figure 4: Measured GI synchronized with GIf (predicted 30 minutes ago) between 11:00 and 12:00. (Lo Err: better prediction accuracy, Hi Err: worse prediction accuracy)
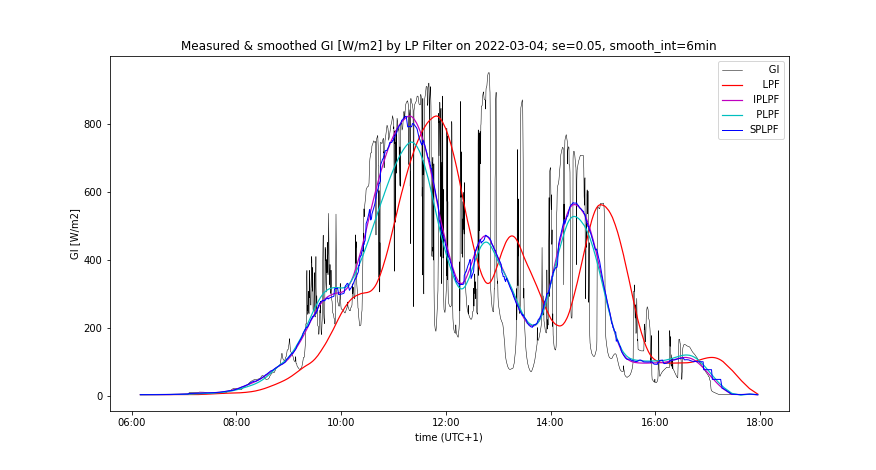
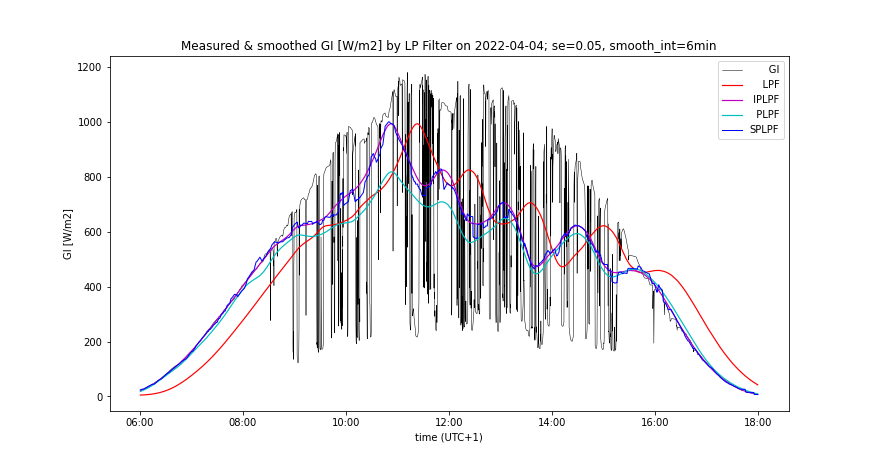
Figure 5: Measured and smoothed GI by 4 different methods; better prediction accuracy
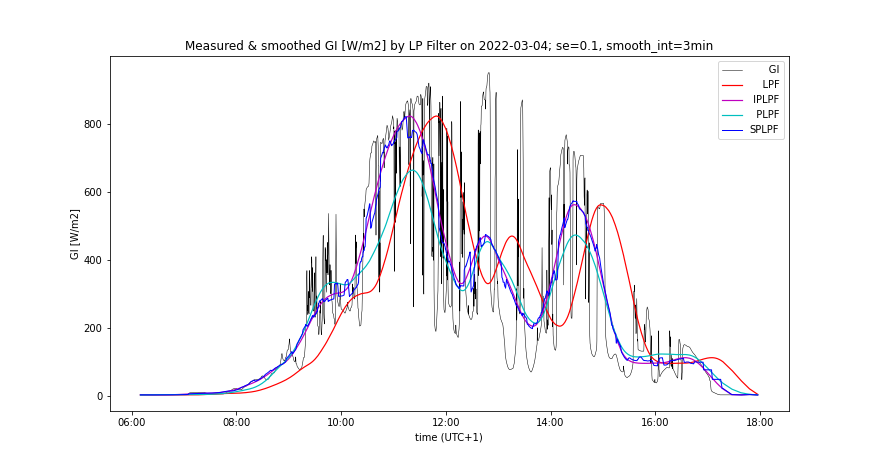
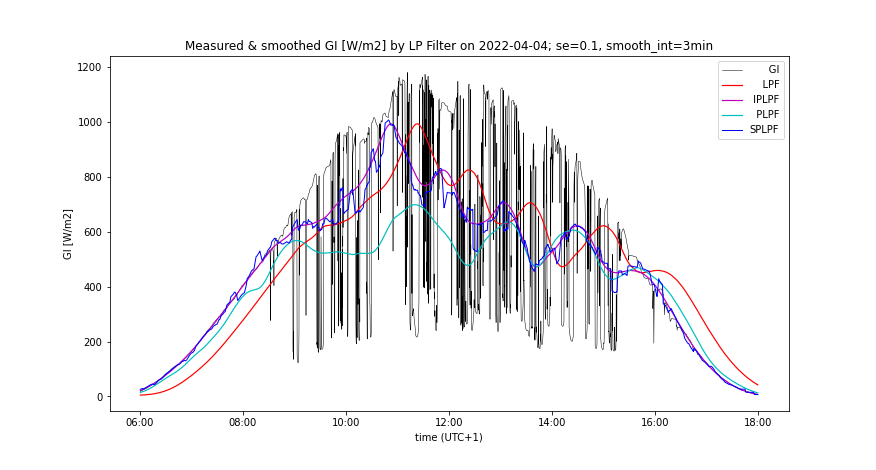
Figure 6: Measured and smoothed GI by 4 smoothing methods; worse prediction accuracy
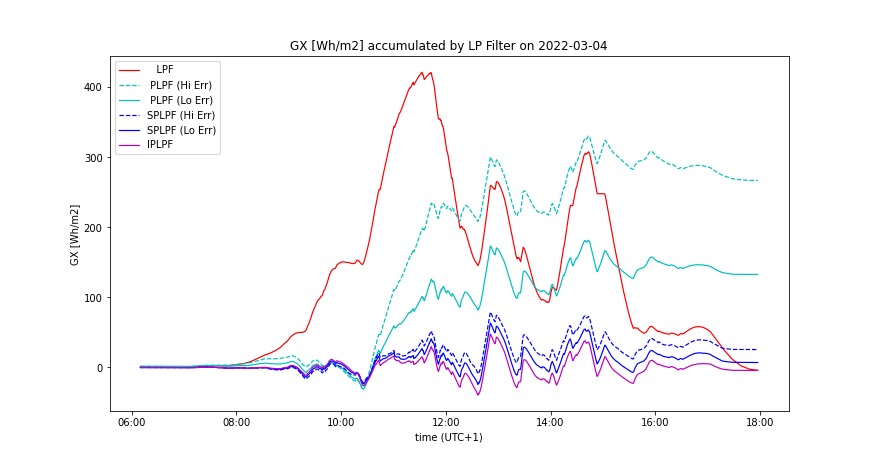
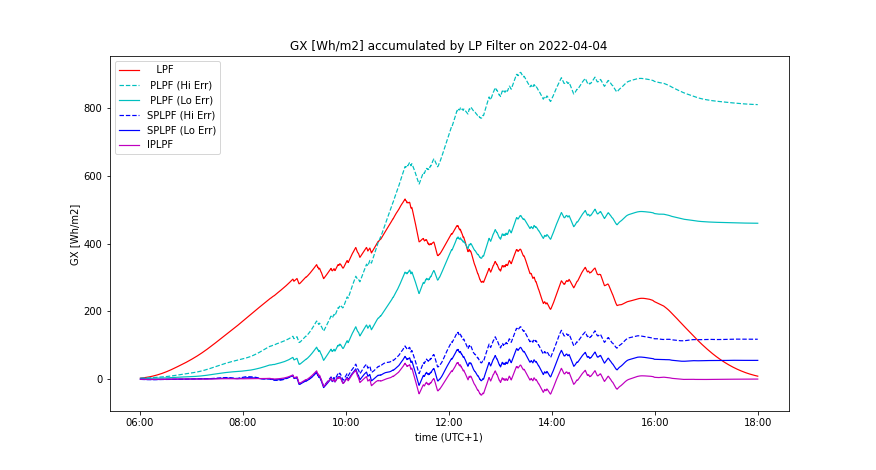
Figure 7: Time course of GX accumulated by 4 smoothing methods. (Lo Err: better prediction accuracy, Hi Err: worse prediction accuracy)
A day with high insolation
Figure 8: Measured GI synchronized with GIf (predicted 30 minutes ago) between 11:00 and 12:00. (Lo Err: better prediction accuracy, Hi Err: worse prediction accuracy)
Figure 9: Measured and smoothed GI by 4 smoothing methods; better prediction accuracy
Figure 10: Measured and smoothed GI by 4 smoothing methods; worse prediction accuracy
Figure 11: Time course of GX accumulated by 4 smoothing methods. (Lo Err: better prediction accuracy, Hi Err: worse prediction accuracy)
Analysis by LPF order
Following graphs compare the smoothing by IPLPF vs SPLPF method:
A day with medium insolation
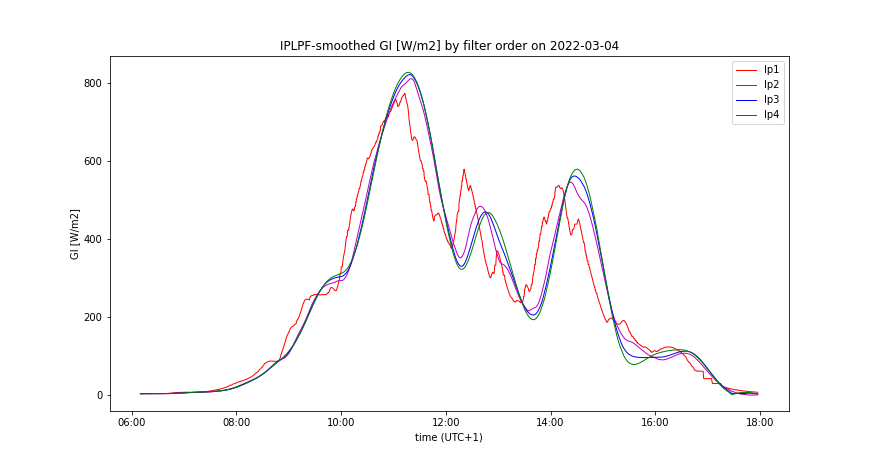
Figure 12: Time course of IPLPF-smoothed GI exhibits similar ramping for each filter order
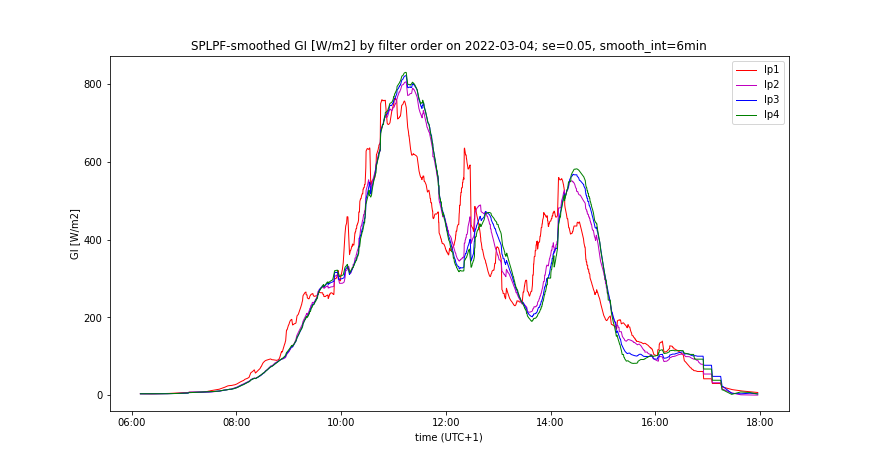
Figure 13: Time course of SPLPF-smoothed GI by filter order; better prediction accuracy
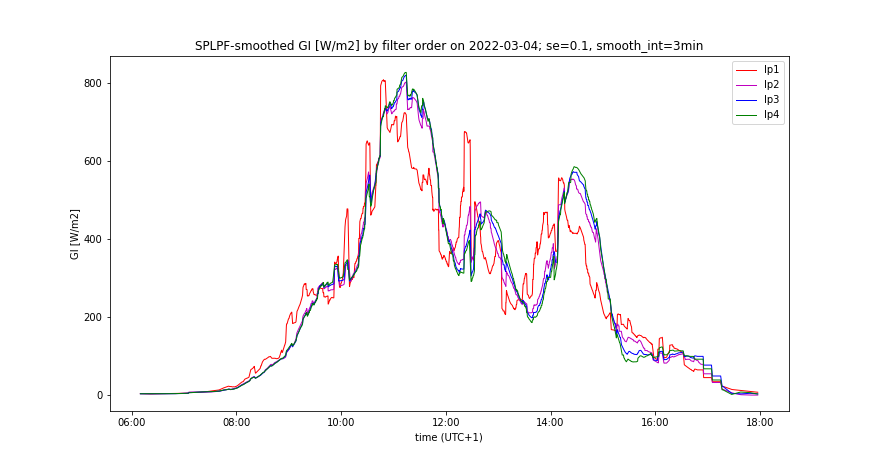
Figure 14: Time course of SPLPF-smoothed GI by filter order; worse prediction accuracy
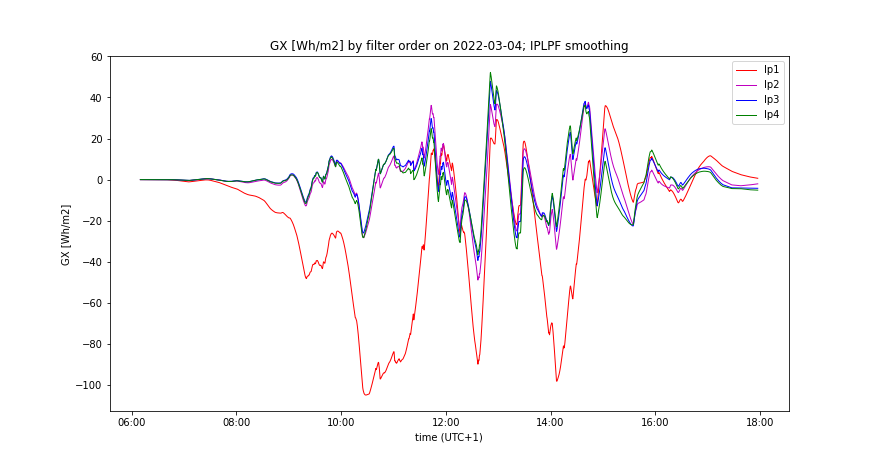
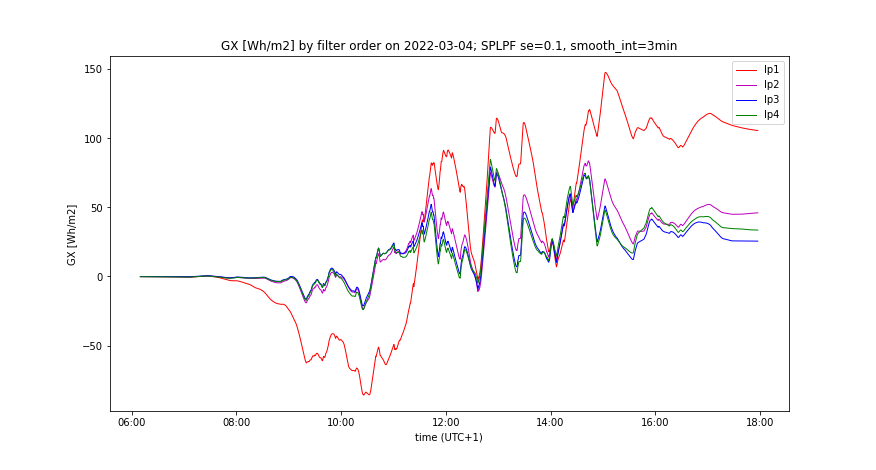
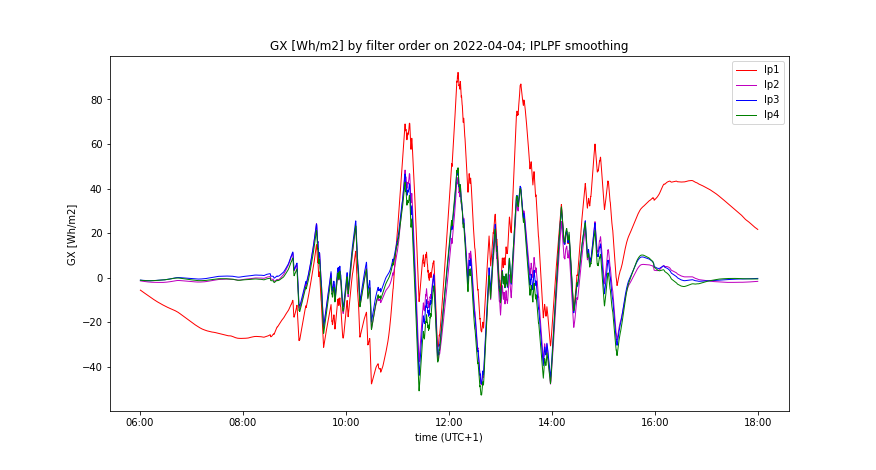
Figure 15: Time course of IPLPF-accumulated GX by filter order
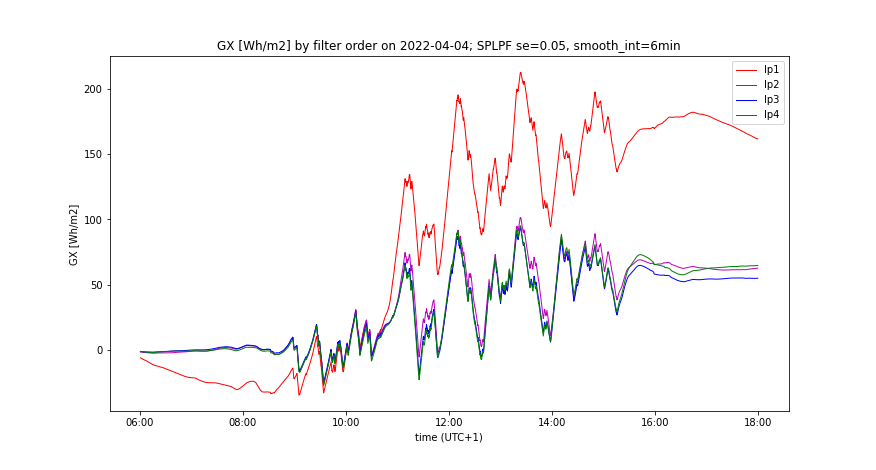
Figure 16: Time course of SPLPF-accumulated GX by filter order; better prediction accuracy
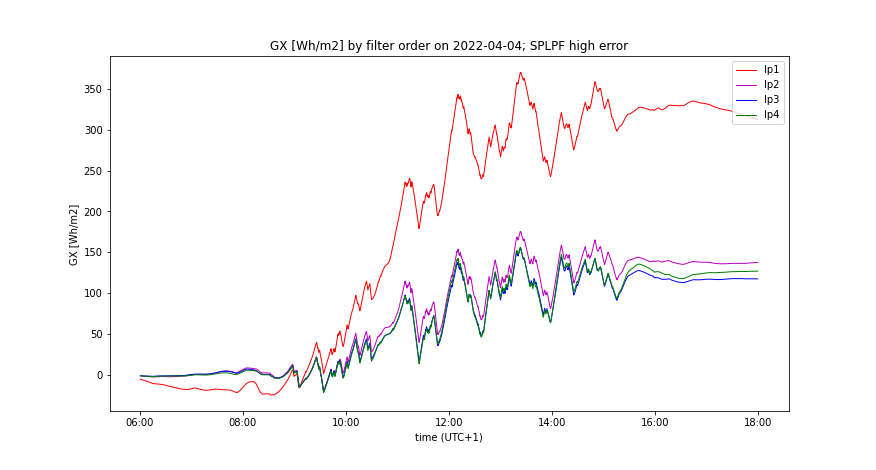
Figure 17: Time course of SPLPF-accumulated GX by filter order; worse prediction accuracy
.
A day with high insolation
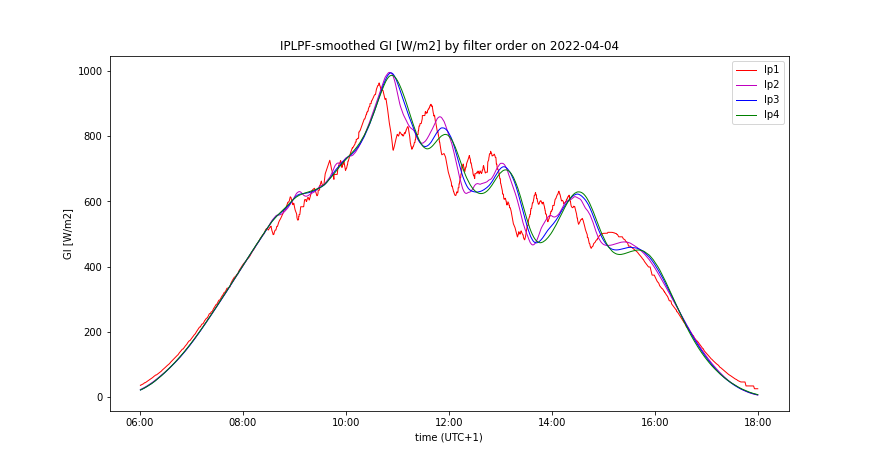
Figure 18: Time course of IPLPF-smoothed GI shows its similar ramping for each filter order
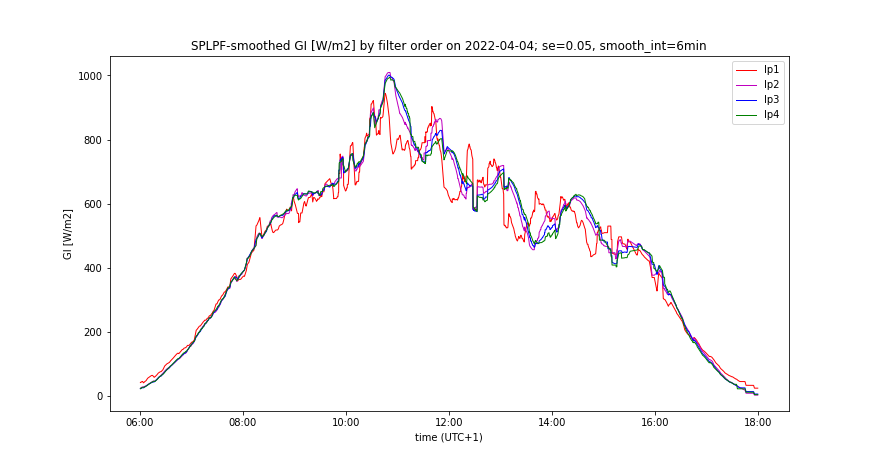
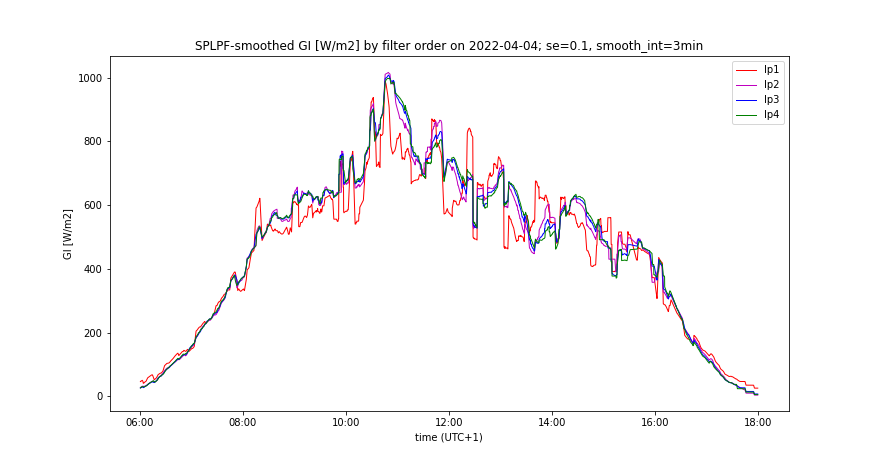
Figure 19: Time course of SPLPF-smoothed GI by filter order; better prediction accuracy
Figure 20: Time course of SPLPF-smoothed GI by filter order; worse prediction accuracy
Figure 21 Time course of IPLPF-accumulated GX by filter order
Figure 22: Time course of SPLPF-accumulated GX by filter order; better prediction accuracy
Figure 23: Time course of SPLPF-accumulated GX by filter order; worse prediction accuracy